# tracy-profiler
Haskell bindings for [Tracy frame profiler](https://github.com/wolfpld/tracy).
## Setup
### Installing
This version of the bindings targets Tracy 0.15.
Older releases have a different C API and will fail to link or misbehave.
You can install the prebuilt package from your distribution if it ships that release:
```sh
sudo apt install libtracy-dev tracy-capture tracy-profiler
```
Or you can download and build one yourself and point your project to it:
```yaml
# stack.yaml
extra-lib-dirs:
- upstream/_build/library
extra-include-dirs:
- upstream/tracy/public/tracy
```
You can use the provided Makefile that will do the thing:
```sh
make all # fetch and build stuff
make test # run the example
upstream/_build/profiler/tracy-profiler & disown # launch the profiler GUI
```
Everything is built in release mode.
Add `DEBUG=1` to any of those `make` commands for a debug build in `upstream/_build-debug`.
Debug builds keep Tracy's assertions on.
To use the debug library in your own project, point `extra-lib-dirs` at `upstream/_build-debug/library`.
This way you can customize configuration.
Make sure you update package flags to match.
The Makefile builds the library with `TRACY_NO_CRASH_HANDLER`.
That means the viewer won't get crash reports.
Tracy's crash handler treats `SIGPIPE` as a crash.
GHC's threaded runtime sends that signal to cancel `interruptible` foreign calls.
With the handler in place, `killThread` on a thread inside such a call aborts the program while a profiler is connected.
Any library built with the handler has this problem.
Check whether a distribution package was built with it.
Either way, you have to ensure that `tracy-capture`/`tracy-profiler` is built with the same version.
Otherwise it will connect and immediately refuse to record anything.
### Flags
The flags must match whatever the library has been built with.
By default all the instrumentation wrappers do nothing.
That means you don't have to `ifdef` your code to remove the wrappers when they're not needed.
You have to set the `enable` flag in your project for the data to be collected.
```yaml
flags:
tracy-profiler:
enable: true
# manual_lifetime: false
# on_demand: false
# fibers: false
```
To use on-demand mode, set the `on_demand` flag and link against a library built with `TRACY_ON_DEMAND`.
`make library-on-demand` builds one in `upstream/_build/library-on-demand`.
Point `extra-lib-dirs` there to use it.
The flag has to match the library.
The C API symbols don't encode that setting.
A mismatch links fine and then misbehaves at runtime.
## Instrumentation
Use the functions from `System.Tracy` and `System.Tracy.Zone` to collect data:
```haskell
{-# LANGUAGE MagicHash #-} -- "static strings"#
{-# LANGUAGE OverloadedLabels #-} -- #fuchsia colors
{-# LANGUAGE OverloadedStrings #-} -- "yes"
module Main where
import Control.Monad (unless, when)
import System.Exit (die)
import System.IO (hPutStrLn, stderr)
import qualified System.Tracy as Tracy
import qualified Data.Text as Text
main :: IO ()
main = Tracy.withProfiler $ do
when Tracy.enabled do
hPutStrLn stderr "Waiting for tracy-capture or tracy-profiler to connect on port 8086"
isConnected <- Tracy.waitConnected 100000 (Just 30_000_000)
unless isConnected $ die "Nothing connected within 30 seconds"
Tracy.withSrcLoc "main.nowhereInParticular" #f0fa do
Tracy.messageL "hi there"# -- static strings require no copying to be logged
mapM_ runFrame [0..600]
runFrame :: Int -> IO ()
runFrame ix = Tracy.withSrcLoc "runFrame" #fcc do
Tracy.frameMark_
let factorial = product [1 .. toInteger ix]
let !digits = length (show factorial)
Tracy.message . Text.pack $
-- runtime strings will require some memcpy'ng around, use sparingly on hot paths
"!" <> show ix <> " has " <> show digits <> " digits"
Tracy.plotInt "digits"# digits
```
Other modules cover more of the C API:
- `System.Tracy.Memory` reports allocations and frees.
- `System.Tracy.Section` marks high-level stretches of execution, such as a game level.
Sections can overlap and aren't tied to a thread.
- `System.Tracy.Lock` and `System.Tracy.SharedLock` report waiting on and holding a lock.
Give each one a location from `System.Tracy.SourceLocation.newSourceLocation`.
The location stays allocated for the rest of the program because Tracy reads it later.
Wait, obtain, shared release and mark events are recorded against the current OS thread.
Use a bound thread to get them on the right timeline.
Tracy 0.15's C API records a successful `SharedLock.tryAcquireShared` as an exclusive hold.
The matching `releaseShared` doesn't end that hold.
- `System.Tracy.Zone.withSourceLocation` runs a zone from a location made once with `newSourceLocation`.
`withSrcLoc` allocates a new location for every zone instead.
- `System.Tracy.Gpu` reports work done on the GPU.
You issue the GPU timestamp queries yourself.
Zones take an action that writes one and returns its query id.
They call it at each end of the zone.
Once the GPU has the results, pass each query id and its timestamp to `Gpu.time` in the order the queries were written.
After that, the id can be reused.
Tracy takes the first timestamp it gets for a zone as its start.
`newContext` takes the length of a GPU tick in nanoseconds and a current GPU timestamp.
Use `newCalibratedContext` instead for contexts that will get `calibration` events.
The C API doesn't hand out context ids.
Choose them from 0 to 255 yourself.
Don't reuse ids of contexts made by C++ code in the same program.
Tracy keeps one zone stack per context created through the C API.
Zones in a context have to nest even across threads.
With `on_demand`, a zone that starts before a viewer connects isn't recorded.
Its timestamp actions aren't called.
The module uses Tracy's serialized queue.
It works from any thread.
The unserialized GPU functions in `System.Tracy.FFI` are cheaper.
They need all events for a context to come from one OS thread.
- `frameImage pixels width height lag flipped` attaches a screenshot to a frame.
The pixels are RGBA.
The width and height have to be multiples of 4.
Tracy copies the pixels before `frameImage` returns.
`lag` counts how many frames ago the image was taken.
`flipped` means the rows go from bottom to top, as in OpenGL.
Call stack depths are only available through `System.Tracy.FFI` so far.
`beginSamplingProfiling` and `endSamplingProfiling` only take effect in a library built with `TRACY_SAMPLING_PROFILER_MANUAL_START`.
## Collecting and viewing
Start `tracy-capture` before running the test to avoid empty areas where nothing happens:
```sh
tracy-capture -fo output.tracy &
```
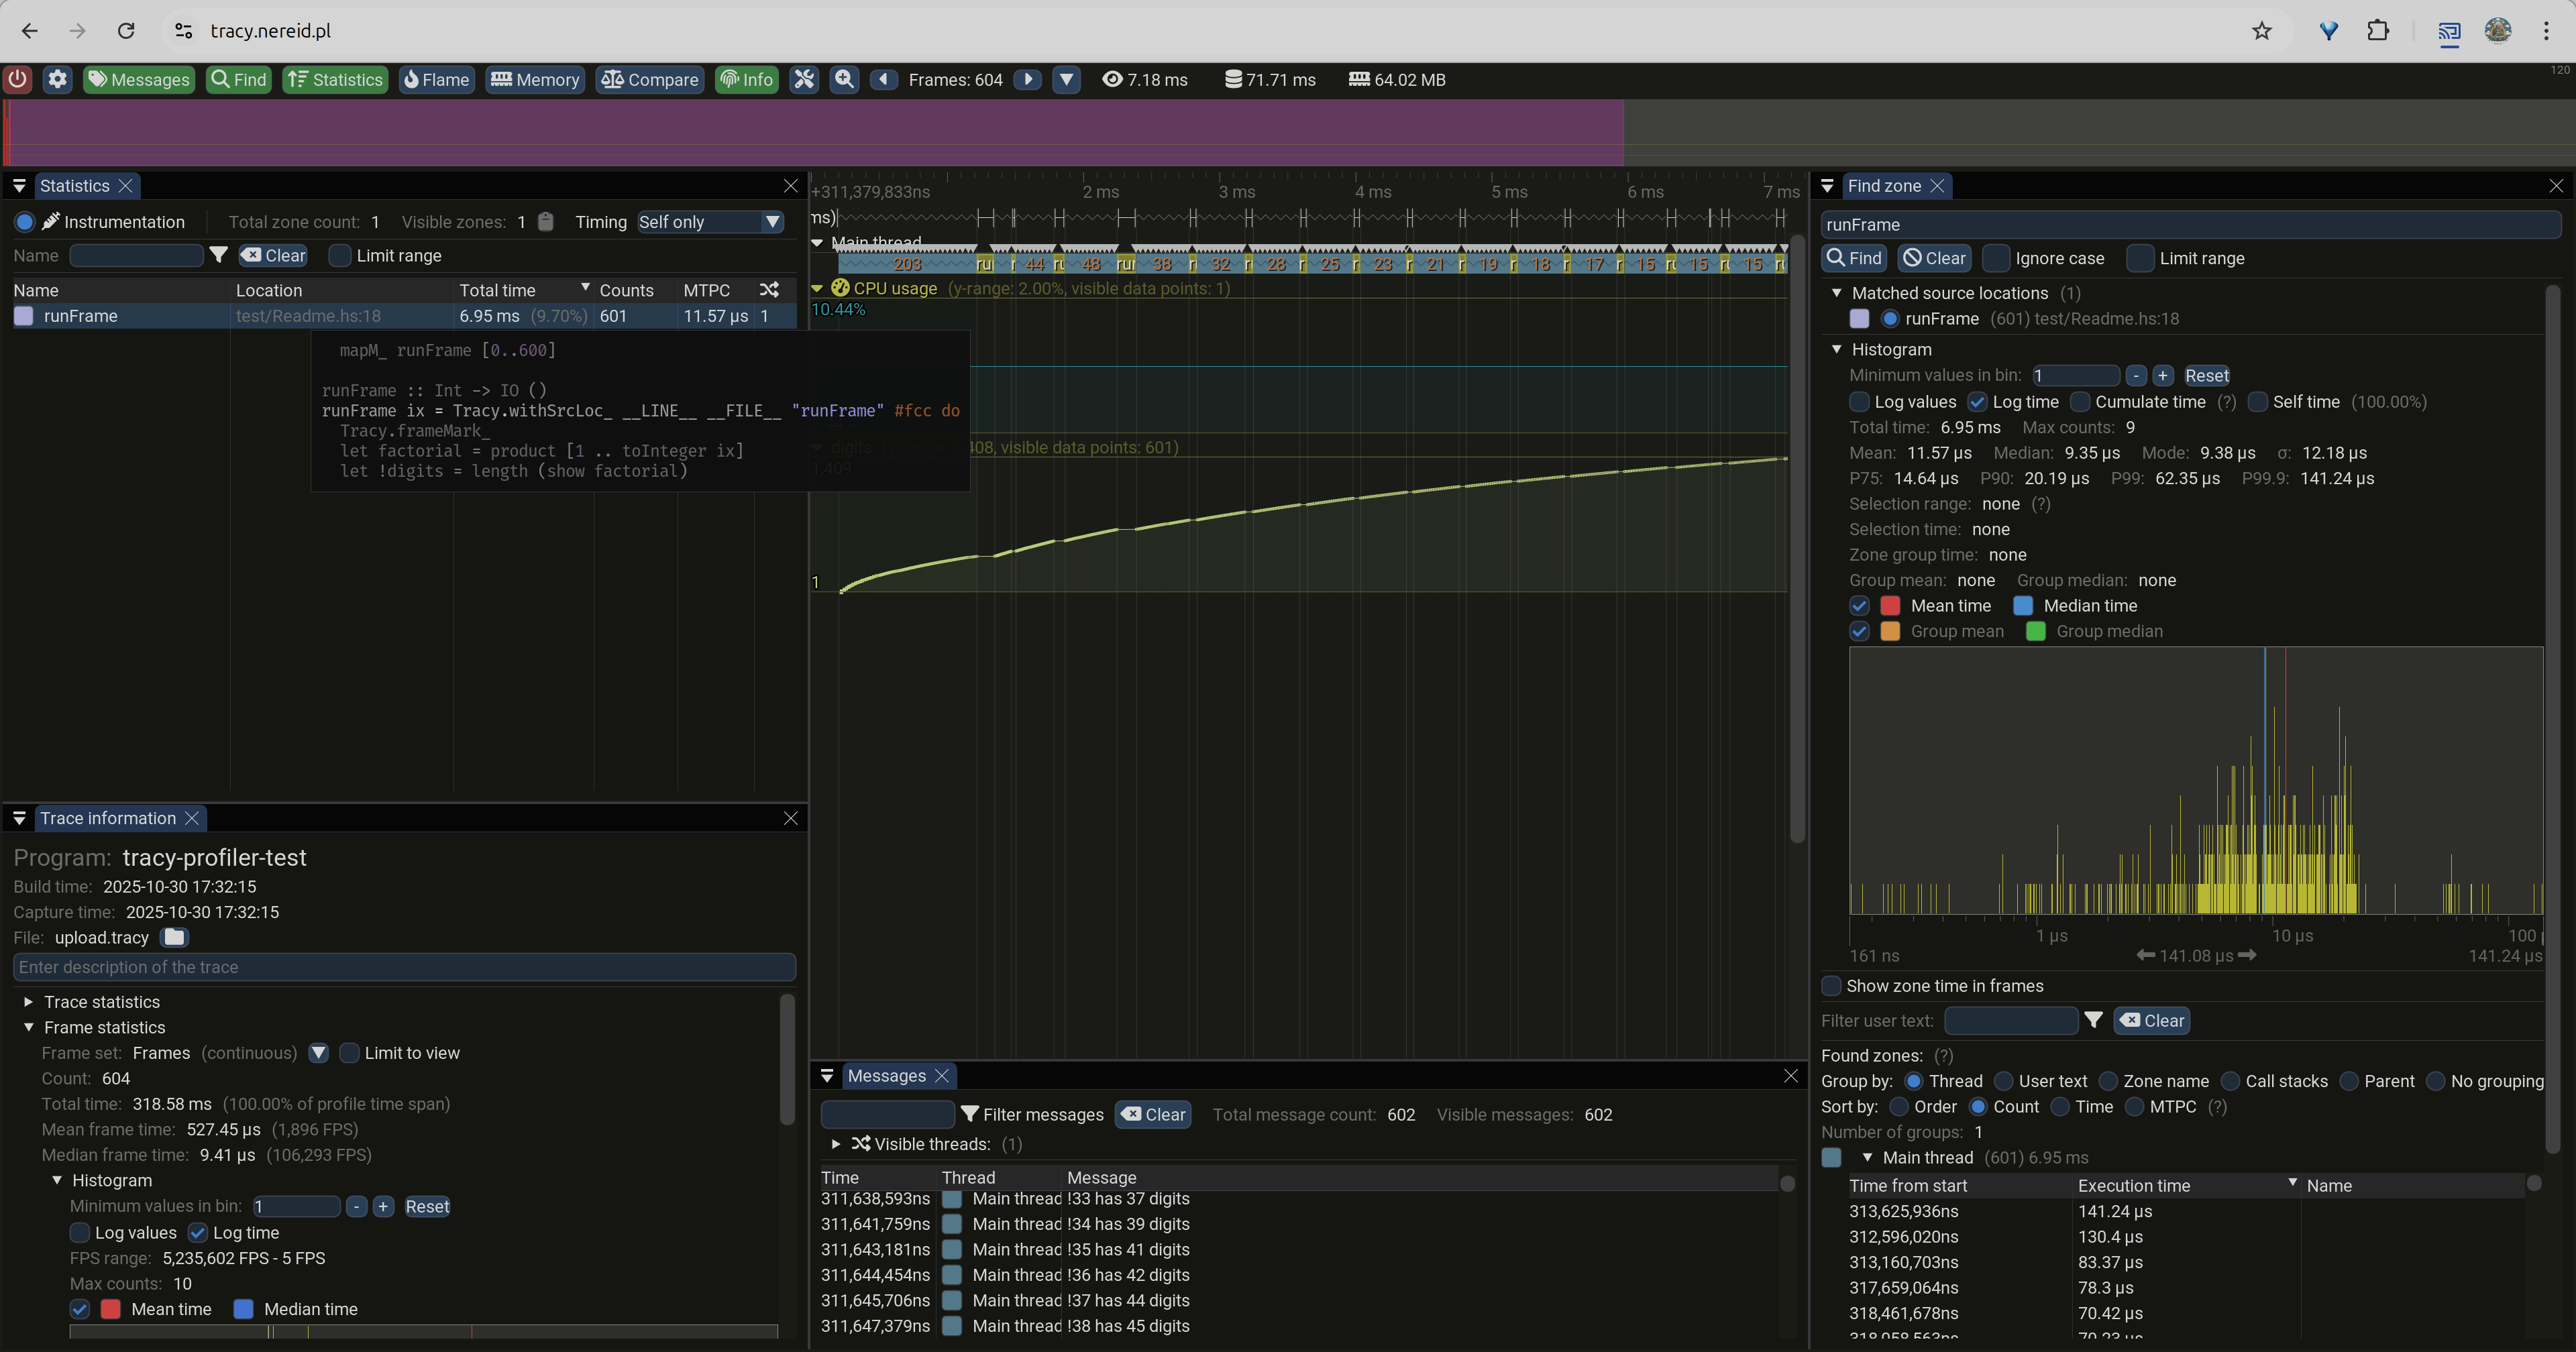
After running the code, upload the collected data to [the viewer](https://tracy.nereid.pl/).
You'll see something like this:
> Are those are GC pauses we're looking at? 🤔
### Sampling
On Linux, Tracy also samples call stacks and records context switches when `kernel.perf_event_paranoid` allows it.
Otherwise it logs a series of debug messages about failing to set up system tracing and carries on without it.
Sampled call stacks show up as ghost zones on threads that have no zones of their own.
In Haskell code, only the top frame of each sample can be trusted.
Tracy has the kernel build the rest by following frame pointers.
GHC uses the frame pointer register (`rbp` on x86-64) as its Haskell stack pointer instead.
The frames past the top one are leftovers from the Haskell stack.
Set `TRACY_NO_SAMPLING=1` in the program's environment to skip sampling while keeping context switches.
Ghost zones can also be hidden in the viewer.
Tracy names sampled frames from debug info or from the symbols an executable exports.
A GHC-built program has neither by default.
Its own frames show as `[unknown]`.
Add `-optl-rdynamic` to the executable's `ghc-options` to export them.
That names frames in the RTS, the Tracy client and Haskell code.
Haskell names come out in GHC's encoded form, such as `Main_main_info`.
## RTFM
You really should go read the official [manual](https://github.com/wolfpld/tracy/releases/download/v0.15.0/tracy.pdf).
Yes, BEFORE you run into corrupted memory, surprising grouppings, or otherwise botched profiling runs.