# tracy-profiler
Haskell bindings for [Tracy frame profiler](https://github.com/wolfpld/tracy).
## Setup
### Installing
You can install the prebuilt package from your distribution if it has one:
```sh
sudo apt install libtracy-dev tracy-capture tracy-profiler
```
Or you can download and build one yourself and point your project to it:
```yaml
# stack.yaml
extra-lib-dirs:
- upstream/_build/library
extra-include-dirs:
- upstream/tracy/public/tracy
```
You can use the provided Makefile that will do the thing:
```sh
make all # fetch and build stuff
make test # run the example
_build/profiler/tracy-profiler & disown # launch the profiler GUI
```
This way you can customize configuration.
Make sure you update package flags to match.
Either way, you have to ensure that `tracy-capture`/`tracy-profiler` is built with the same version.
Otherwise it will connect and immediately refuse to record anything.
### Flags
The flags must match whatever the library has been built with.
By default all the instrumentation wrappers do nothing.
That means you don't have to `ifdef` your code to remove the wrappers when they're not needed.
You have to set the `enable` flag in your project for the data to be collected.
```yaml
flags:
tracy-profiler:
enable: true
# manual_lifetime: false
# fibers: false
```
## Instrumentation
Use the functions from `System.Tracy` and `System.Tracy.Zone` to collect data:
```haskell
{-# LANGUAGE MagicHash #-} -- "static strings"#
{-# LANGUAGE OverloadedLabels #-} -- #fuchsia colors
{-# LANGUAGE OverloadedStrings #-} -- "yes"
module Main where
import qualified System.Tracy as Tracy
import qualified Data.Text as Text
main :: IO ()
main = Tracy.withProfiler $ do
Tracy.waitConnected_ -- wait for the tracy-capture to connect
Tracy.withSrcLoc "main.nowhereInParticular" #f0fa do
Tracy.messageL "hi there"# -- static strings require no copying to be logged
mapM_ runFrame [0..600]
runFrame :: Int -> IO ()
runFrame ix = Tracy.withSrcLoc "runFrame" #fcc do
Tracy.frameMark_
let factorial = product [1 .. toInteger ix]
let !digits = length (show factorial)
Tracy.message . Text.pack $
-- runtime strings will require some memcpy'ng around, use sparingly on hot paths
"!" <> show ix <> " has " <> show digits <> " digits"
Tracy.plotInt "digits"# digits
```
## Collecting and viewing
Start `tracy-capture` before running the test to avoid empty areas where nothing happens:
```sh
tracy-capture -fo output.tracy &
```
Run the code, then upload the collected data to [the viewer](https://tracy.nereid.pl/).
You'll see something like this:
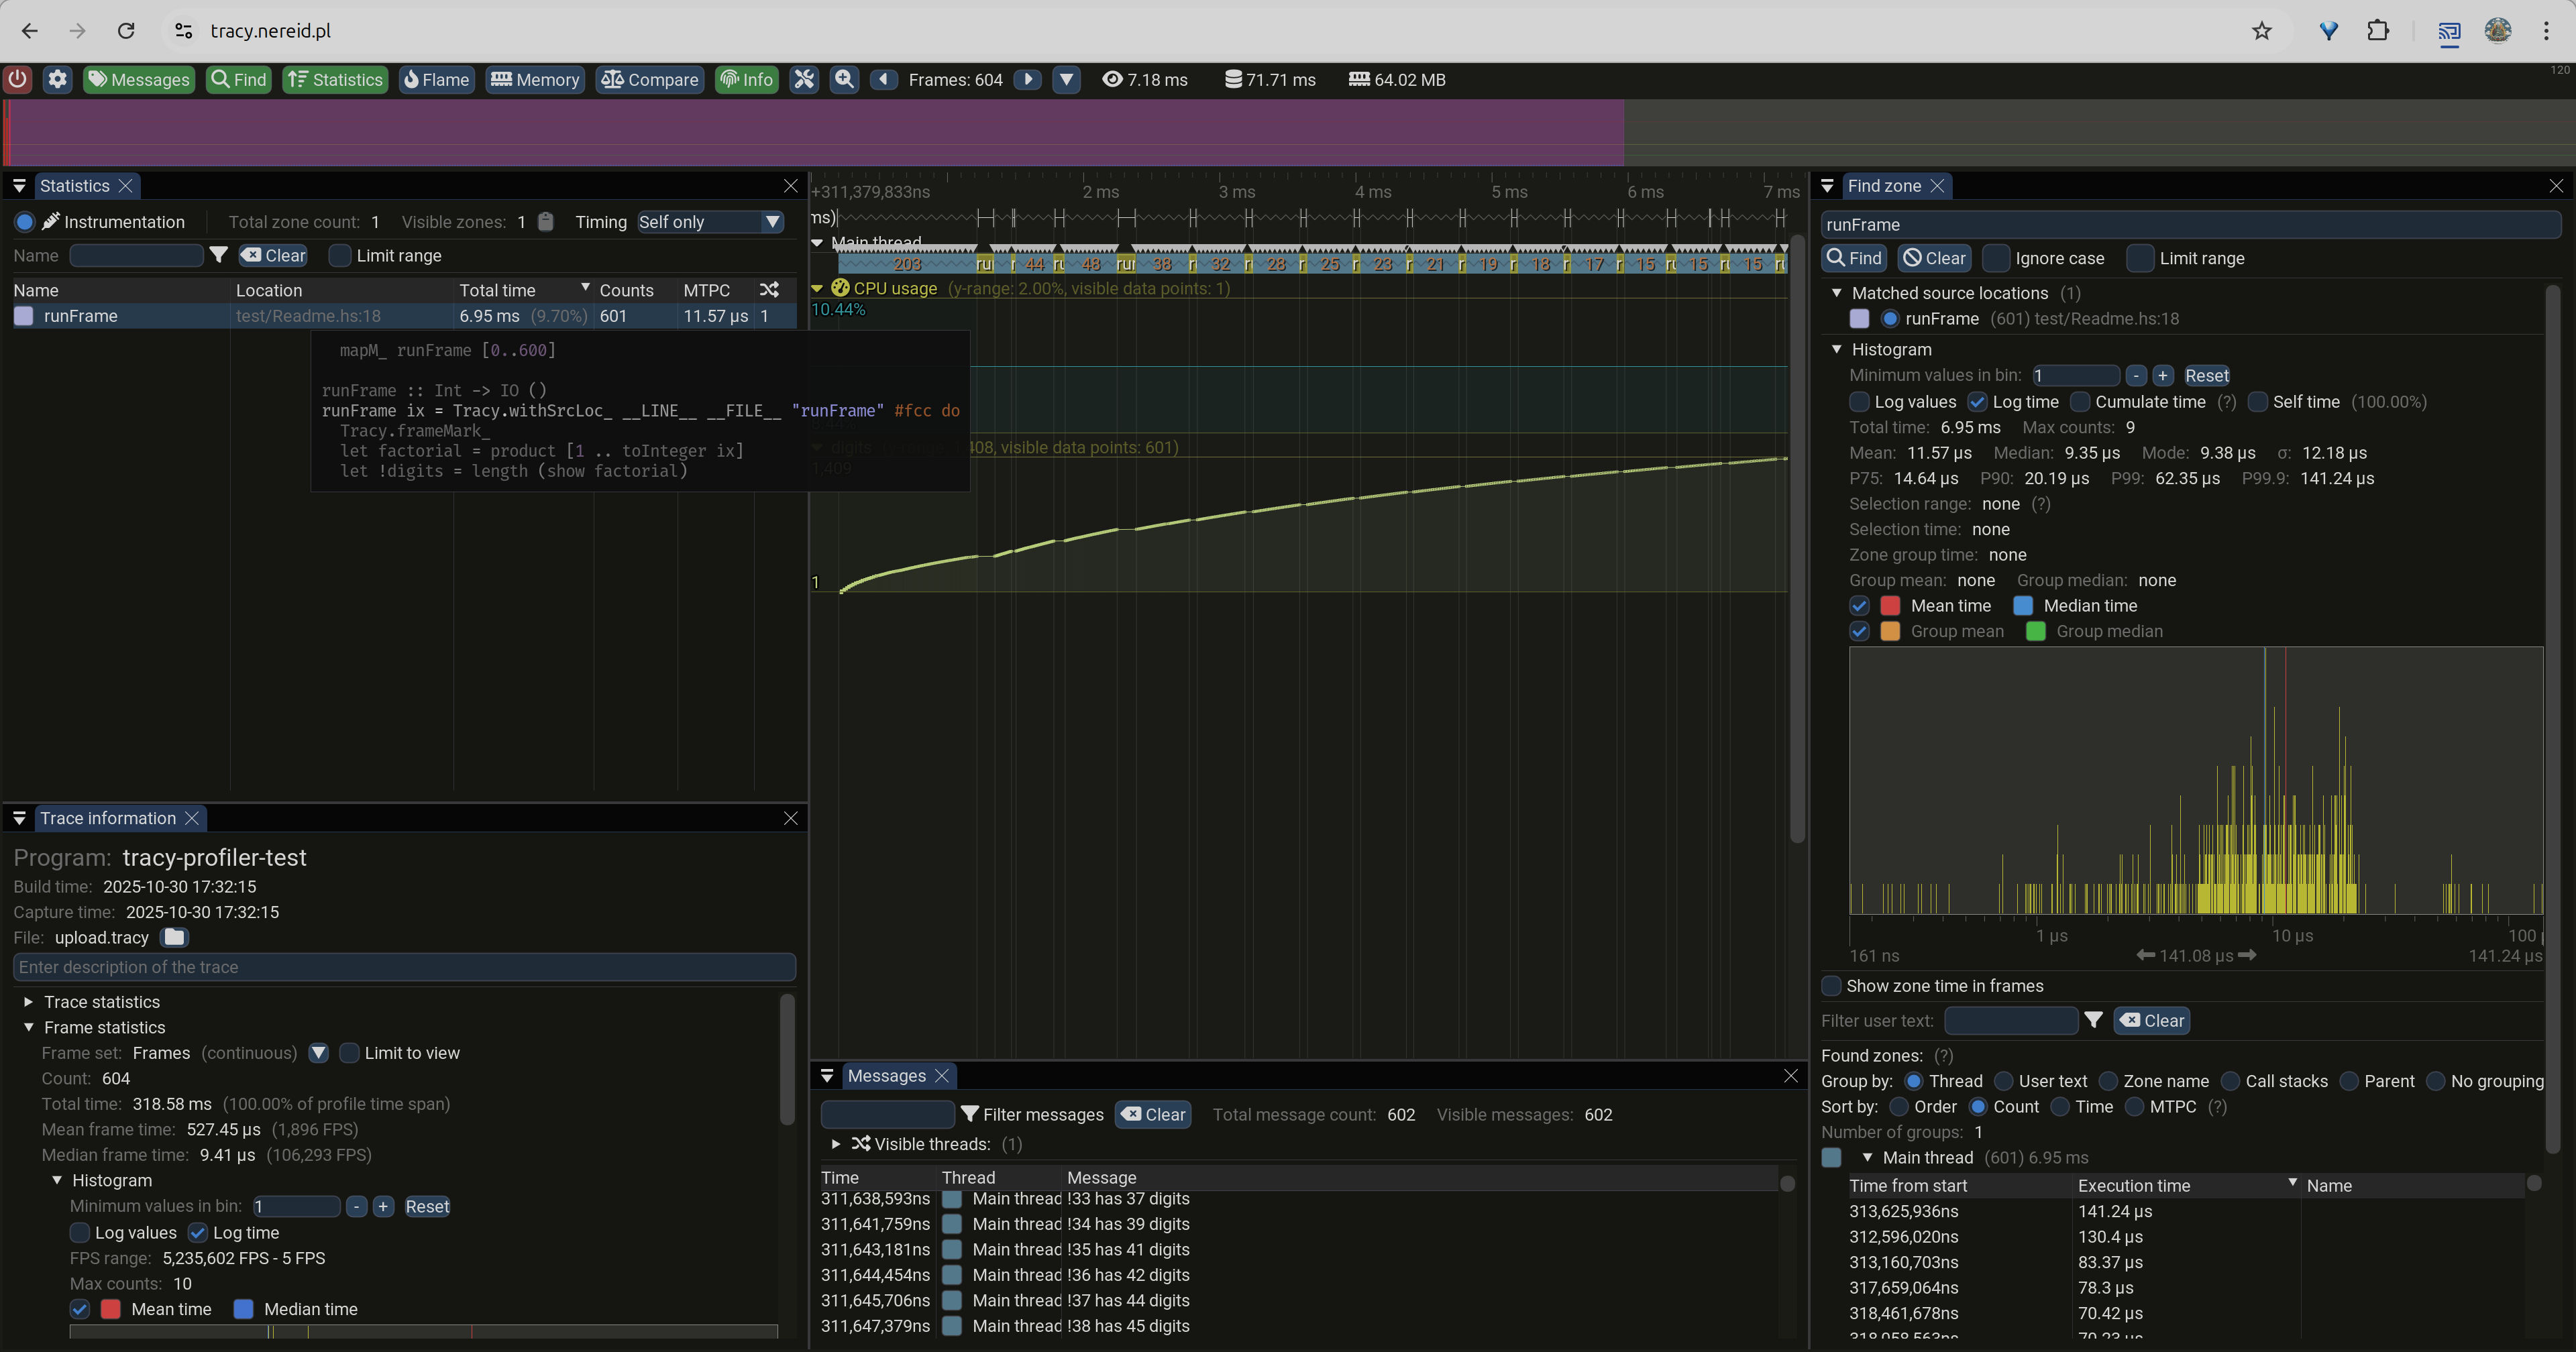
> Are those are GC pauses we're looking at? 🤔
## RTFM
You really should go read the official [manual](https://github.com/wolfpld/tracy/blob/master/manual/tracy.md).
Yes, BEFORE you run into corrupted memory, surprising grouppings, or otherwise botched profiling runs.