# tdigest-Chart
A [`Chart`](http://hackage.haskell.org/package/Chart) plotting of [`tdigest`](http://hackage.haskell.org/package/tdigest)
## Examples
These are outputs of the test-suite
```sh
inkscape --export-png=example1.png --export-dpi=80 --export-background-opacity=0 --without-gui example1.svg
inkscape --export-png=example2.png --export-dpi=80 --export-background-opacity=0 --without-gui example2.svg
```
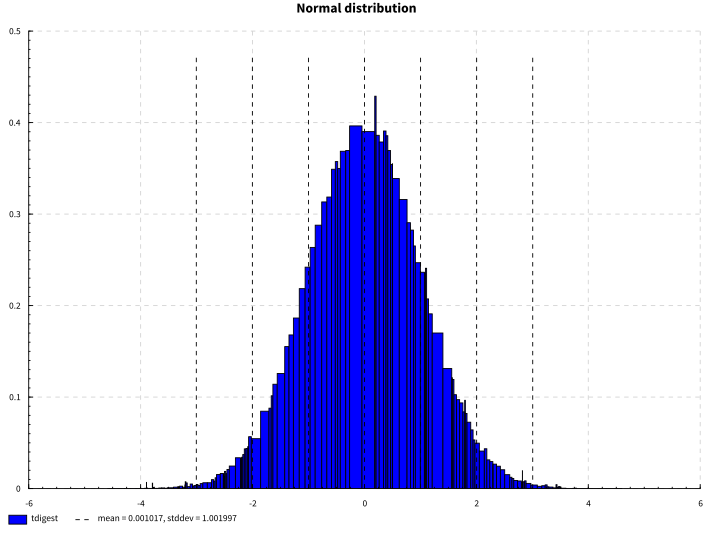
### Standard normal distribution
```haskell
Chart.layout_title Chart..= "Normal distribution"
Chart.plot $ do
p <- Chart.tdigestPlot "tdigest" td
return $ Chart.tdigestToPlot $ p
& Chart.plot_tdigest_normalize .~ True
& Chart.plot_tdigest_deviations .~ Just 3
```
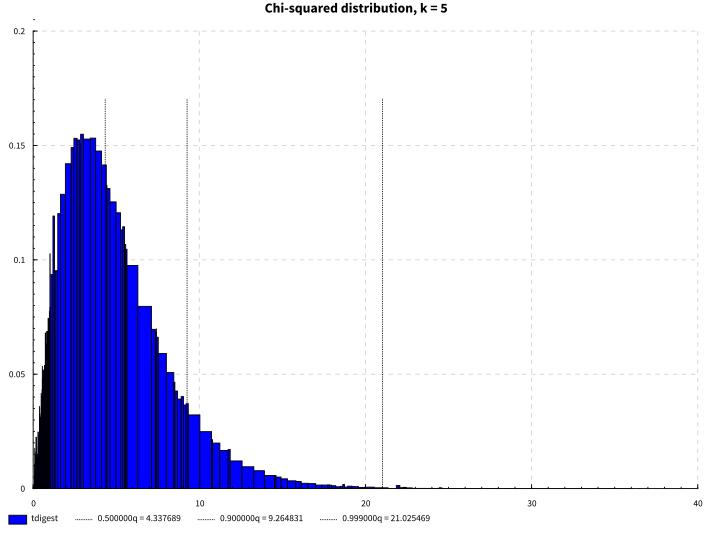
### Chi-squared distribution, k = 5
```haskell
Chart.layout_title Chart..= "Chi-squared distribution, k = 5"
Chart.plot $ do
p <- Chart.tdigestPlot "tdigest" td
return $ Chart.tdigestToPlot $ p
& Chart.plot_tdigest_normalize .~ True
& Chart.plot_tdigest_quantiles .~ [0.5, 0.9, 0.999]
```