plots-0.1.0.0: README.md
# plots
[](https://cchalmers.github.io/plots/)
`plots` is a plotting library based on [diagrams](http://projects.haskell.org/diagrams).
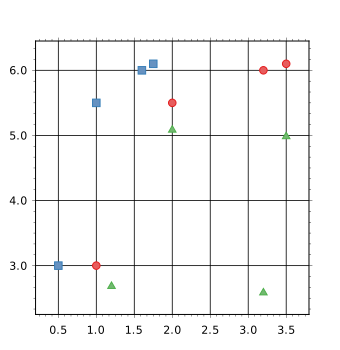
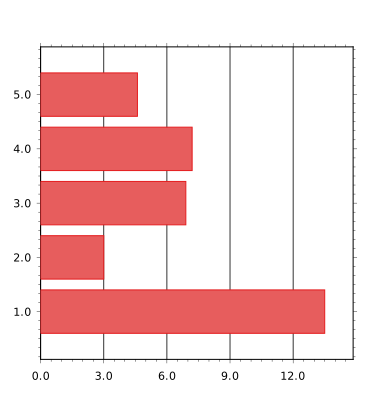
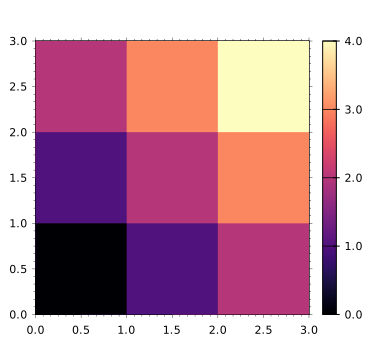
Some sample plots:
#### Scatter plot
#### Bar plot
#### Heat map
There are many more plots to be added. There are also plans to support
3D plots. Issues and pull requests welcome.
## Examples
There are several example plots in the `examples/` directory. To build
the examples, first ensure that you have `stack` installed, and that you
have a `stack.yaml` file in this directory that contains the lines:
```yaml packages:
- '.'
- 'test'
```
(If you run the command `stack init`, stack will automatically generate
the `stack.yaml` file with the appropriate packages.)
You can then build the examples using ```sh stack build stack exec
RunExamples ``` The `RunExamples` script will generate `png` files in
the `examples_output` directory.
**Note:** The `RunExamples` script re-builds an example if the output
file (`examples_output/X.png`) does not exist, or if the source file
(`examples/X.hs`) has been modified since the last time the script was
run.