# plot-gtk-ui
[](https://travis-ci.org/sumitsahrawat/plot-gtk-ui)
An ambitious attempt to provide mathematica like dynamic plotting for free.
## Installation
```bash
stack install plot-gtk-ui
```
## Usage
> The best way to try this is to use the [calculator](https://github.com/sumitsahrawat/calculator.git) package.
Import `Graphics.Rendering.Plot.Gtk.UI` and follow the examples below.
```haskell
import Graphics.UI.Gtk
import Graphics.Rendering.Plot.Gtk.UI
main = do
initGUI
plotStatic sin (-pi, pi)
-- Plot sin(x) from -pi to pi
mainGUI
```
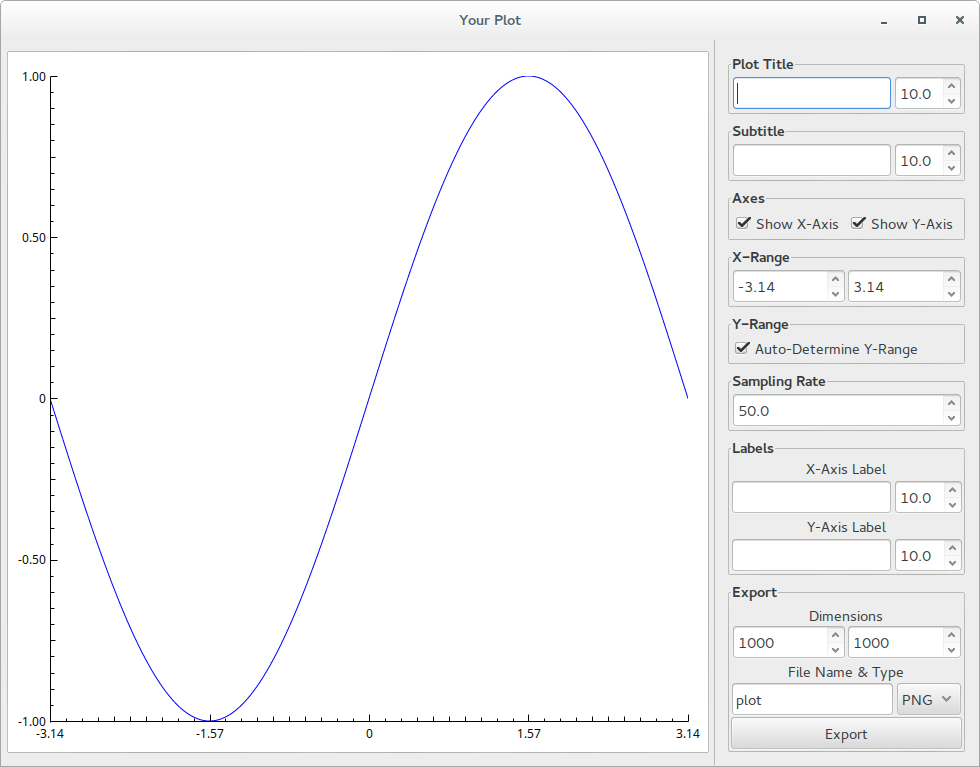
Another simple example.
```haskell
import Graphics.UI.Gtk
import Graphics.Rendering.Plot.Gtk.UI
main = do
initGUI
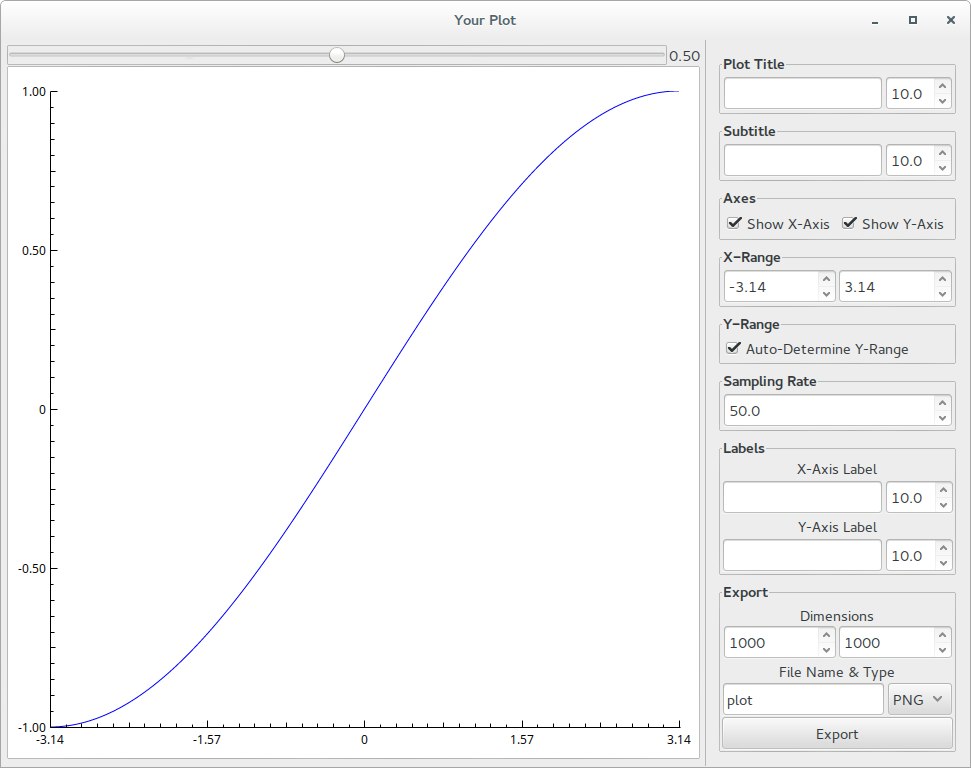
plotDynamic (\(x, a) -> sin(a * x)) ((-pi, pi), (0, 1))
-- Plot sin(a * x), where 'x' ranges from -pi to
-- pi and 'a' ranges between 0 to 1
mainGUI
```
## Errors
The error messages might not be completely correct, as there is not a good way to diagnose what caused the error.
Issues that cause errors:
- Invalid ranges, e.g. X-Range = `(1, -1)`
- Automatic-determination of ranges resulting in unplottable ranges, e.g. `(0, 0)`
If you land on the "Gray screen of no plots" or any other incorrect error message, please raise an issue here.
## Implementation
The `plotStatic` and `plotDynamic` functions are implemented in a
type-safe manner using `fixed-vector`.
It also allows one to write functions using appropriate tuples as in the
above examples.
Plotting is done using the excellent [plot](https://github.com/amcphail/plot)
package.