hvega-0.12.0.7: README.md
# hvega
[](https://hackage.haskell.org/package/hvega)
[](https://vega.github.io/vega-lite/)
[](https://github.com/DougBurke/hvega/actions)
[](http://packdeps.haskellers.com/feed?needle=hvega)
Create [Vega-Lite](https://vega.github.io/vega-lite/) visualizations in
Haskell. It targets version 4.15 of the Vega-Lite specification. Note that
the module does not include a viewer for these visualizations (which are
JSON files), but does provide several helper functions, such as
[toHtmlFile](https://hackage.haskell.org/package/hvega/docs/Graphics-Vega-VegaLite.html#v:toHtmlFile),
which create HTML that can be viewed
with a browser to display the visualization. Other approaches include
automatic display in IHaskell notebooks - with the
[ihaskell-vega](https://hackage.haskell.org/package/ihaskell-hvega)
package - or use of external viewers such as
[Vega View](https://hackage.haskell.org/package/vega-view) and
[Vega-Desktop](https://github.com/vega/vega-desktop).
It started off being a copy on an early version (2.2.1) of the
[Elm Vega library](http://package.elm-lang.org/packages/gicentre/elm-vega/2.2.1/VegaLite),
which is released under a BSD3 license by Jo Wood of the giCentre at the
City University of London.
This code is released under the BSD3 license.
## Examples
### Cars
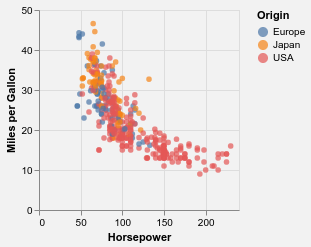
The [Vega-Lite example gallery](https://vega.github.io/vega-lite/examples/) contain
a number of visualizations of the `cars.json` dataset, which has a number of
columns to display, such as "Horsepower", "Miles_per_Gallon", and "Origin". The
following code will create a visualization that plots the efficiency of the
cars (the "mpg") as a function of its Horsepower, and color-code by the
origin of the car:
```Haskell
let cars = dataFromUrl "https://vega.github.io/vega-datasets/data/cars.json" []
enc = encoding
. position X [ PName "Horsepower", PmType Quantitative ]
. position Y [ PName "Miles_per_Gallon", PmType Quantitative, PTitle "Miles per Gallon" ]
. color [ MName "Origin" ]
bkg = background "rgba(0, 0, 0, 0.05)"
in toVegaLite [ bkg, cars, mark Circle [MTooltip TTEncoding], enc [] ]
```
When the JSON is viewed with a Vega-Lite aware viewer, the resultant plot
can be interacted with (e.g. to use the tooltip support) using the
[interactive version](https://vega.github.io/editor/#/url/vega-lite/N4IgtghgTg1iBcoAuB7FAbJBLADg0AxigHZICmpCIFRAJlsQOYgC+ANCEgJ45lUFYoBdH3YhaEJBHwgArlHRUAFkiQ4AzvAD0WgG5lGEAHSMsSJbIBGRrCj0GIAWglT1ZJOq0uIWgtHVGAFbqJKwcACTqBEpkkMqqGtr2hiZmFta2WlExkMlO6GZkegAsQSHEIBw0KPRMMkToKFAyAGZYZOi0VADyUFimFWIAHq3tnVQAEk1uOCgA7mTNHNy8VACOshCkZpJY+mEgXKMdXfAgALJYIuoA+rxQNwDiEOiNFctmIlSX1wAE979nq9QsseHwzhsttgpNh9iwxJYIAQYIwoChZMRTiAoIxEQAKAAMbF+RJJxIJRgJAFYAJSsIA).
It can also be viewed as a PNG:
### Betelgeuse
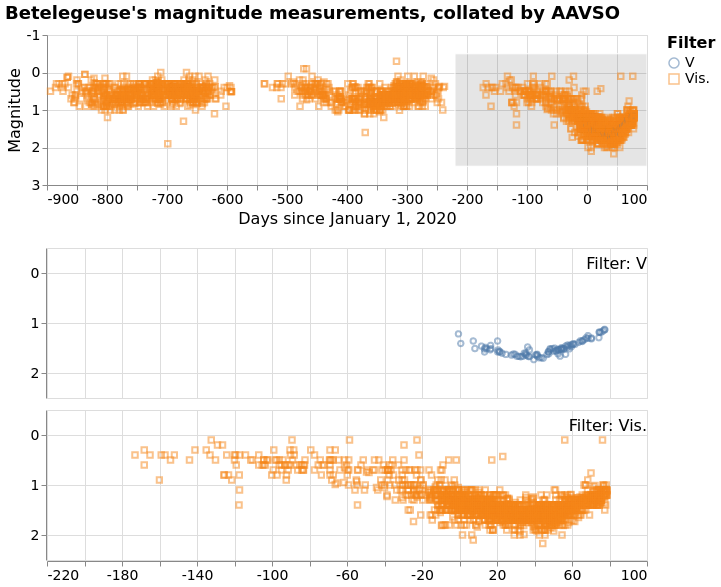
In late 2019 and early 2020 the
[star Betelgeuse](https://en.wikipedia.org/wiki/Betelgeuse) - a member of the
[constellation Orion](https://en.wikipedia.org/wiki/Orion_(constellation)) -
dimmed enough that you could see it. Betelgeuse is a member of the class of
Red Supergiant stars, which are massive enough that they will go supernova
at some point, and so there was
[some speculation](https://en.wikipedia.org/wiki/Betelgeuse#2019%E2%80%932020_fading)
that we could see a "naked-eye" supernova (even though the current models
suggest that Betelgeuse has about 100,000 more years to go before this happens,
and the rapid brightening in mid 2023 has also got some people's hopes up).
This interest lead to a lot of observations added to the
[American Association of Variable Star Observers](https://www.aavso.org/)
database, which we are going to look at below. This example is rather-more
involved than the case one, since it involves data filtering and creation,
multiple plots, faceting, and interactive selection.
```Haskell
let titleStr = "Betelegeuse's magnitude measurements, collated by AAVSO"
w = width 600
h = height 150
pos1Opts fld ttl = [PName fld, PmType Quantitative, PTitle ttl]
x1Opts = pos1Opts "days" "Days since January 1, 2020"
y1Opts = pos1Opts "magnitude" "Magnitude" ++ [PSort [Descending], yRange]
yRange = PScale [SDomain (DNumbers [-1, 3])]
filtOpts = [MName "filterName"]
filtEnc = color (MLegend [ LTitle "Filter", LTitleFontSize 16, LLabelFontSize 14 ] : filtOpts)
. shape filtOpts
circle = mark Point [ MOpacity 0.5, MFilled False ]
encOverview = encoding
. position X x1Opts
. position Y y1Opts
. filtEnc
selName = "brush"
pos2Opts fld = [PName fld, PmType Quantitative, PNoTitle,
PScale [SDomainOpt (DSelectionField selName fld)]]
x2Opts = pos2Opts "days"
y2Opts = pos2Opts "magnitude" ++ [PSort [Descending]]
encDetail = encoding
. position X x2Opts
. position Y y2Opts
. filtEnc
xlim = (Number (-220), Number 100)
ylim = (Number (-0.5), Number 2.5)
overview = asSpec [ w
, h
, encOverview []
, selection
. select selName Interval [ Encodings [ChX, ChY]
, SInitInterval (Just xlim) (Just ylim)
]
$ []
, circle
]
detailPlot = asSpec [ w
, h
, encDetail []
, circle
]
headerOpts = [ HLabelFontSize 16
, HLabelAlign AlignRight
, HLabelAnchor AEnd
, HLabelPadding (-24)
, HNoTitle
, HLabelExpr "'Filter: ' + datum.label"
]
details = asSpec [ columns 1
, facetFlow [ FName "filterName"
, FHeader headerOpts
]
, spacing 10
, specification detailPlot
]
in toVegaLite [ title titleStr [ TFontSize 18 ]
, dataFromUrl "https://raw.githubusercontent.com/DougBurke/hvega/master/hvega/data/betelgeuse-2020-03-19.json" []
, transform
. filter (FExpr "datum.filterName[0] === 'V'")
. filter (FExpr "datum.magnitude < 4")
. calculateAs "datum.jd - 2458849.0" "days"
$ []
, vConcat [overview, details]
, configure
. configuration (Axis [ TitleFontWeight Normal, TitleFontSize 16, LabelFontSize 14 ])
$ []
]
```
This can be viewed as
- an [interactive version](https://vega.github.io/editor/#/url/vega-lite/N4IgLgTghgdgzgMwPYQLYgFwG1QIJYA2YAphJiACZRgCuqAdPkaQHJSrFYAMAugAQBeIXwDkANREgAvgBpchEmQyVqdeqigBzGHloVifADx8ALNLkgocclQCe1mSADGUAk5oFqxG6oYArCj4AWj4AJhMAVgAOKJMATnouaR5HJyQYfE1MUCgADzxrDFAwXQJiADF0sAB1YjxNAAswchgUDQIQR08AI2ICSpgwAGU8AC9vDABGE0cSsDKB4bGJyYA2KVkVMChskBoIDuUmsAAHOAwAegvoAHd6TV0Gmm6aOFI0weJB+jTUC4ARJA0TQAIX2AGtiBcGgA3YiaKAXDRwRTQuEIi5UbYXXokAiaYivYhBUJcUlBLgAZiCkwSfjg6XMIBhHxczWwoAadUa7MmES4jg0EHBuyQJygTl0tkwXHoEVmthOExAJyQeEGnRATDKFEwCFcb02NzwFDADUwqy4ApAbzKThKjKKIG6EFe5qd6t0u1ymCwJNJMkmVpSIGl2ApcpkoTlPE2XzSFHVmkKWBAPsc0pDYEVyvVihhrmkcZgCaTuzSBBQu3wfV1yiYijYHE1ZQJMDroB6fUWI3GmGms1KyvKClImrmCyqvZW602cAaUCV1bwtfIDdY7G8mx9TprBDrKns46H5H+UHsfDg6qcBgAUrAaFAILY+JMZGEyUkFUvlABHR+DLo1B4HCTJhvIq7KBo2i6DQ+ianALhlLsFBIBo6q+jSMiUrGjgMhA7KUMQiFfImMBZIO8zKgAsloOh6N437Kv+sBzMBoEbLIoBwEqTi7Fy9RNP2-KCk+IpOmKEpSjKkbgDm5CqnmmrasQdb6gQhqOMaprupa1rxkgZFZE6FZVruK77muo4QE2jEgK2pG7F2-RTss-YzOAJ7KCOzBkJRk6DNO-aznhC4-hBln1tZtlMjuEUHnYDg2khEygKh6EwMukGHkltrEPaeCOs6rrzkW-kTDAHgEEx5AsYB2wlBxGZZZFIDQfRcF2YhripZQaFQBh5nZe1sHwXhfT5Q6mXKC6bplTaKCEfoJHtmW5WYJVBDVXJP4gHVbGNVuGypEgBB0PA-aOPqN7svFVm+TFjhclA+hKJ2UC9AQACCJYNGZICOV0H19AAorkJxKCAIg+YoGCiHwADUfBYmozktsDBAAAovUZmAkh5zk9m5UyrOtGCbdtzlfQQ9TTSAECCc0x02uKkrkf2XBSCGAAkiFcho5DHGclwXOiUD3I8zz0IVFx88QGii-CUBBDTJCiyY9D0oyZPFMQuSESCxB4vChJvCIcB8CNDGW8QVj7PLXxgHA74Vp4JCBN0L5fV9YhDAA8sprl9lMUSbMtTgMycU3kAAEkgNx8AuFuG3iBJEubfAuozMDERbBYM6p77dFYql8OkyPUFAfCu14Htez7-t8AAFEL5xXDcHf0FAUAwgy9AoJoFwAJT0HwACaQKXn9HiBAaSB8JWSDgnw1CJ2ApxtxcYDGuvpA-GhOJG303RIGAK-tmvG8iw8ZpS780J4CcJyQofeIn2Ao8AJJnzcVgr1tfAzQGGgASMuMBLxIElK4G2iYq6ryAZebYBEy4IA-KSeg0ggA)
- as a PNG:
## Documentation
A tutorial is provided as part of the module: it is based, as is
so much of the module, on the
[Elm Vega walk through](https://github.com/gicentre/elm-vegalite/tree/master/docs/walkthrough).
The tutorial
is [available on hackage](https://hackage.haskell.org/package/hvega/docs/Graphics-Vega-Tutorials-VegaLite.html) - and includes the plot outputs -
and the plots it creates are also available by importing the
`Graphics.Vega.Tutorials.VegaLite` module.
The
[Vega-Lite Example Gallery](https://vega.github.io/vega-lite/examples/) has
been converted to IHaskell notebooks in the
[notebooks directory](https://github.com/DougBurke/hvega/tree/master/notebooks).
Start with the
[overview notebook](https://github.com/DougBurke/hvega/blob/master/notebooks/VegaLiteGallery.ipynb),
which describes the set up, and then the individual
sections have their own notebooks (with names of
`VegaLiteGallery-<section>.ipynb`.
It is **strongly advised** that you stick with `jupyter notebook`
rather than `jupyter lab`, since the 0.3 release of `ihaskell-hvega`
provides **much better** support for the former than the latter.
The notebooks have been created using Jupyter Lab (thanks to Tweag I/O's
[JupyterWith environment](https://www.tweag.io/posts/2019-02-28-jupyter-with.html)).
## Differences to Elm Vega
Elm Vega has changed significantly since I started `hvega`, and no-longer
exposes data types directly but uses functions instead: for example,
rather than `PName`, it uses a function like `pName`. It is an open
question whether `hvega` will make the same switch. Over time
the naming of certain operations or data types has diverged between
`hevga` and Elm Vega.
One of the more-obvious changes is that the output of `toVegaLite`
is a separate type from the input values - that is `VegaLite`
and `VLSpec` - since it makes it easier to display the output of
`hvega` in `IHaskell`. The JSON specification is retrieved from
this type with `fromVL`. The `0.5.0.0` release adds some more
type safety (restricting the functions that can be applied
to `encoding` and `transform` for instance).