# Haskell Debugger
We are working on a first class debugger for Haskell!
 
# Installation
Please find up to date installation instructions on the
[project homepage](https://well-typed.github.io/haskell-debugger/)!
> [!WARNING]
> `hdb` can currently be compiled with GHC 9.14
> The first release it will be compatible with is GHC 9.14.
To install and use the debugger, you need the executable `hdb`
and the VSCode extension [Haskell Debugger](https://marketplace.visualstudio.com/items?itemName=Well-Typed.haskell-debugger-extension).
Since `hdb` implements the [Debug Adapter Protocol
(DAP)](https://microsoft.github.io/debug-adapter-protocol/), it also supports
debugging with tools such as vim, neovim, or emacs -- as long as a DAP client is
installed and the `launch` arguments for `hdb` configured.
To run the debugger, the same version of GHC which compiled it needs to be in
PATH. Make sure the DAP client knows this. For instance, to launch VSCode with a specific GHC use:
```
PATH=/path/to/ghc-dir:$PATH code /path/to/proj
```
# Usage
To use the debugger in VSCode, select the debugger tab, select Haskell Debugger,
and create a `launch.json` file by clicking the debugger settings icon (next to
the green run button). Now, it is also supported to just Run a file which
contains a `main` function.
The `launch.json` file contains some settings about the debugger session here.
Namely:
| Setting | Description |
| --- | --- |
| `projectRoot` | the full path to the project root. this is typically `${workspaceFolder}`, a value which is interpolated by the editor with the actual path |
| `entryFile` | the relative path from the project root to the file with the entry point for execution |
| `entryPoint` | the name of the function that is called to start execution |
| `entryArgs` | the arguments passed to the `entryPoint`. If the `entryPoint` is `main`, these arguments are passed as environment arguments (as in `getArgs`) rather than direct function arguments. |
| `extraGhcArgs` | additional flags to pass to the ghc invocation that loads the program for debugging. |
Change them accordingly.
You can also run the debugger as a server on a specific port by executing `hdb server --port 12345`.
To connect VSCode to this server, add the field `"debugServer": 12345` to your `launch.json` configuration.
To run the debugger, simply hit the green run button.
See the Features section below for what is currently supported.
# Multiple home units session
Multiple home units is supported but currently may require a workaround (issue is tracked by [#38](https://github.com/well-typed/haskell-debugger/issues/38)).
If your multiple home units session does not work by default (e.g. if you
cannot set breakpoints on different units), and you do not have a `hie.yaml`
file, you may want to try creating a `hie.yaml` file in the root of the
workspace with:
```
cradle:
cabal:
component: "all"
```
# Related Work
`hdb` is inspired by the original
[`haskell-debug-adapter`](https://github.com/phoityne/haskell-debug-adapter/) by @phoityne.
`hdb` improves on the original ideas implemented in
`haskell-debug-adapter` but makes them more robust by implementing the debugger
directly via the GHC API (similarly to HLS), rather than by communicating with a
custom `ghci` process.
We have been doing custom work on GHC to support debugging in a predictable,
robust, and more performant way. That is why `hdb` is only
compatible with GHC 9.14. If you want to debug using an older
GHC version (9.12 and older), please check out `haskell-debug-adapter`.
To implement the Debug Adapter Protocol (DAP) server part, we are using the
[`dap`](https://hackage.haskell.org/package/dap-0.2.0.0) library by @dmjio.
`dap` is a framework for building language-agnostic DAP.
The `hdb` is transparently compatible with most projects (simple,
Cabal, Stack, custom `hie.yaml`) because
it uses [`hie-bios`](https://github.com/haskell/hie-bios) to figure out the
right flags to prepare the GHC session with.
# Features
Many not listed! Here are a few things:
## Stepping
- [x] Continue (resume execution forward)
- [x] Next (step within local function)
- [x] Step into (single step to next immediate tick)
- [x] Step out (execute until end of function and break after the call)
### In Reverse
- [ ] Local step backwards (ie reverse of Next)
- [ ] Single step backwards (ie reverse of Step into)
- [ ] Continue backwards (resume execution backwards until a breakpoint is hit)
## Breakpoints
- [x] Module breakpoints
- [x] Function breakpoints
- [x] Exception breakpoints
- [ ] Data breakpoints
- [ ] Instruction breakpoints
### Conditionals
- [x] Conditional breakpoints (breakpoint is hit only if condition is satisfied)
- [x] Hit conditional breakpoints (stop after N number of hits)
## Custom Debug Visualizations
The user can extend the debugger visualization behavior (in a plugin sort of
way) by implementing `DebugView` from
[`haskell-debugger-view`](https://hackage.haskell.org/package/haskell-debugger-view)
for the desired types.
We ship built-in custom instances for various `base` datatypes, such as
`String` and `(a, b)`, and for a core packages as well, such as `Text`,
`ByteString`, `Map` and `IntMap`.
Here is an example of a completely custom `DebugView` instance for a
user-defined datatype. You can also see how the `IntMap` is displayed as a pair
of `Int` keys to their values as opposed as as a `Bin/Tip` tree mimicking its
real definition:

When the package dependency closure includes `haskell-debugger-view`, we will
use that unit specifically. When it is not in the dependencies, we will load a
built-in version in memory.
# Talks
### MuniHac 2025: A modern step-through debugger for Haskell
[](https://youtu.be/urYtE15ryA0)
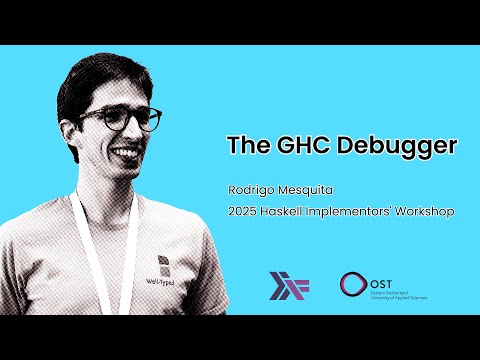
### ZuriHac 2025: Haskell Implementor's Workshop: The GHC Debugger
[](https://youtu.be/p-hBweQg42s)
# Building from source
## Build `hdb` (using Cabal)
```
cabal build -w /path/to/ghc-9.14 exe:hdb
```
## Build and install `hdb` (using Stack)
On non-Windows operating systems:
```
stack install haskell-debugger
```
On Windows:
```
stack -w stack-windows.yaml install haskell-debugger
```
## Build VS Code extension (using Nix)
```
cd vscode-extension
nix-build
```
## Testing
```
cd test/integration-tests
make GHC=/path/to/recent/ghc \
DEBUGGER=$(cd ../.. && cabal list-bin -w /path/to/ghc-9.14 exe:hdb)
```