dr-cabal-0.1.0.0: README.md
# dr-cabal
[](https://github.com/chshersh/dr-cabal/actions)
[](https://hackage.haskell.org/package/dr-cabal)
[](LICENSE)
`dr-cabal` is a CLI tool for profiling Haskell dependencies build times.

> ℹ️ **DISCLAIMER:** This project is developed and maintained in
> free time by volunteers. The development may continue for decades or
> may stop tomorrow. You can use
> [GitHub Sponsorship](https://github.com/sponsors/chshersh) to support
> the development of this project.
## Install
`dr-cabal` is a Haskell CLI tool and can be installed either from
Hackage or from this repository.
### Prerequisites
To start using `dr-cabal`, make sure you have the required version of
`cabal-install` (a Haskell build tool) and GHC (a Haskell compiler)
installed:
* [Cabal ⩾ 3.6.2.0](https://www.haskell.org/cabal/)
* [GHC ⩾ 9.0.2](https://www.haskell.org/downloads/)
### Hackage
To install the latest version of `dr-cabal` from
[Hackage](https://hackage.haskell.org/package/dr-cabal),
follow these steps:
1. Update Hackage index:
```shell
cabal update
```
2. Build `dr-cabal` from Hackage and copy the resulting executable
into the desired location:
```shell
cabal install dr-cabal \
--install-method=copy \
--overwrite-policy=always \
--with-compiler=ghc-9.0.2 \
--installdir=$HOME/.local/bin
```
> ℹ️ **NOTE:** Make sure the `$HOME/.local/bin` directory or the
> directory of your choice is listed in `$PATH`.
### Sources
To build the latest version of `dr-cabal` from sources,
follow these steps:
1. Clone this repository:
```shell
git clone https://github.com/chshersh/dr-cabal.git
cd dr-cabal
```
2. Build the package:
```shell
cabal build
```
3. Copy executable to the desired location:
```shell
cp $(cabal list-bin exe:dr-cabal) ~/.local/bin/dr-cabal
```
> ℹ️ **NOTE:** Make sure the `~/.local/bin` directory or the
> directory of your choice is listed in `$PATH`.
## How to use?
`dr-cabal` usages comprises two steps:
1. 👀 Watching `cabal build` output and recording data into a JSON file.
2. 🌈 Producing pretty profiling results.
### Watch
> ⚠️ **WARNING:** To get meaningful results, the `dr-cabal watch`
> command needs to be run when none of the dependencies are build. If
> you've already build you project, including dependencies, you can
> purge global Cabal cache using the following command:
>
> ```shell
> rm -rf ~/.cabal
> ```
>
> You may prefer a less invasive approach if you have custom global
> Cabal configurations:
>
> ```shell
> rm -rf ~/.cabal/store
> ```
>
> However, with the latter solution you won't see the `Downloading`
> phase in the profiling output.
Run the following command inside the project directory, for which you
want to build the profile chart:
```shell
cabal build all | dr-cabal watch --output=dr-cabal-debug.json
```
This command watches the `cabal build` output and records all the
relevant steps in the `dr-cabal-debug.json` file.
If everything is good, you should see output similar to the below one:

> It's also possible to see the time spent on Haddock. You can run with:
>
> ```shell
> cabal build all --enable-documentation --haddock-all | dr-cabal watch --output=dr-cabal-debug.json
> ```
### Profile
Once you successfully produced a JSON file with all the recorded
steps, run the following command to pretty-print the profiling output:
> ⚠️ **WARNING:** For better results, make your terminal full-screen.
```shell
dr-cabal profile --input=dr-cabal-debug.json
```
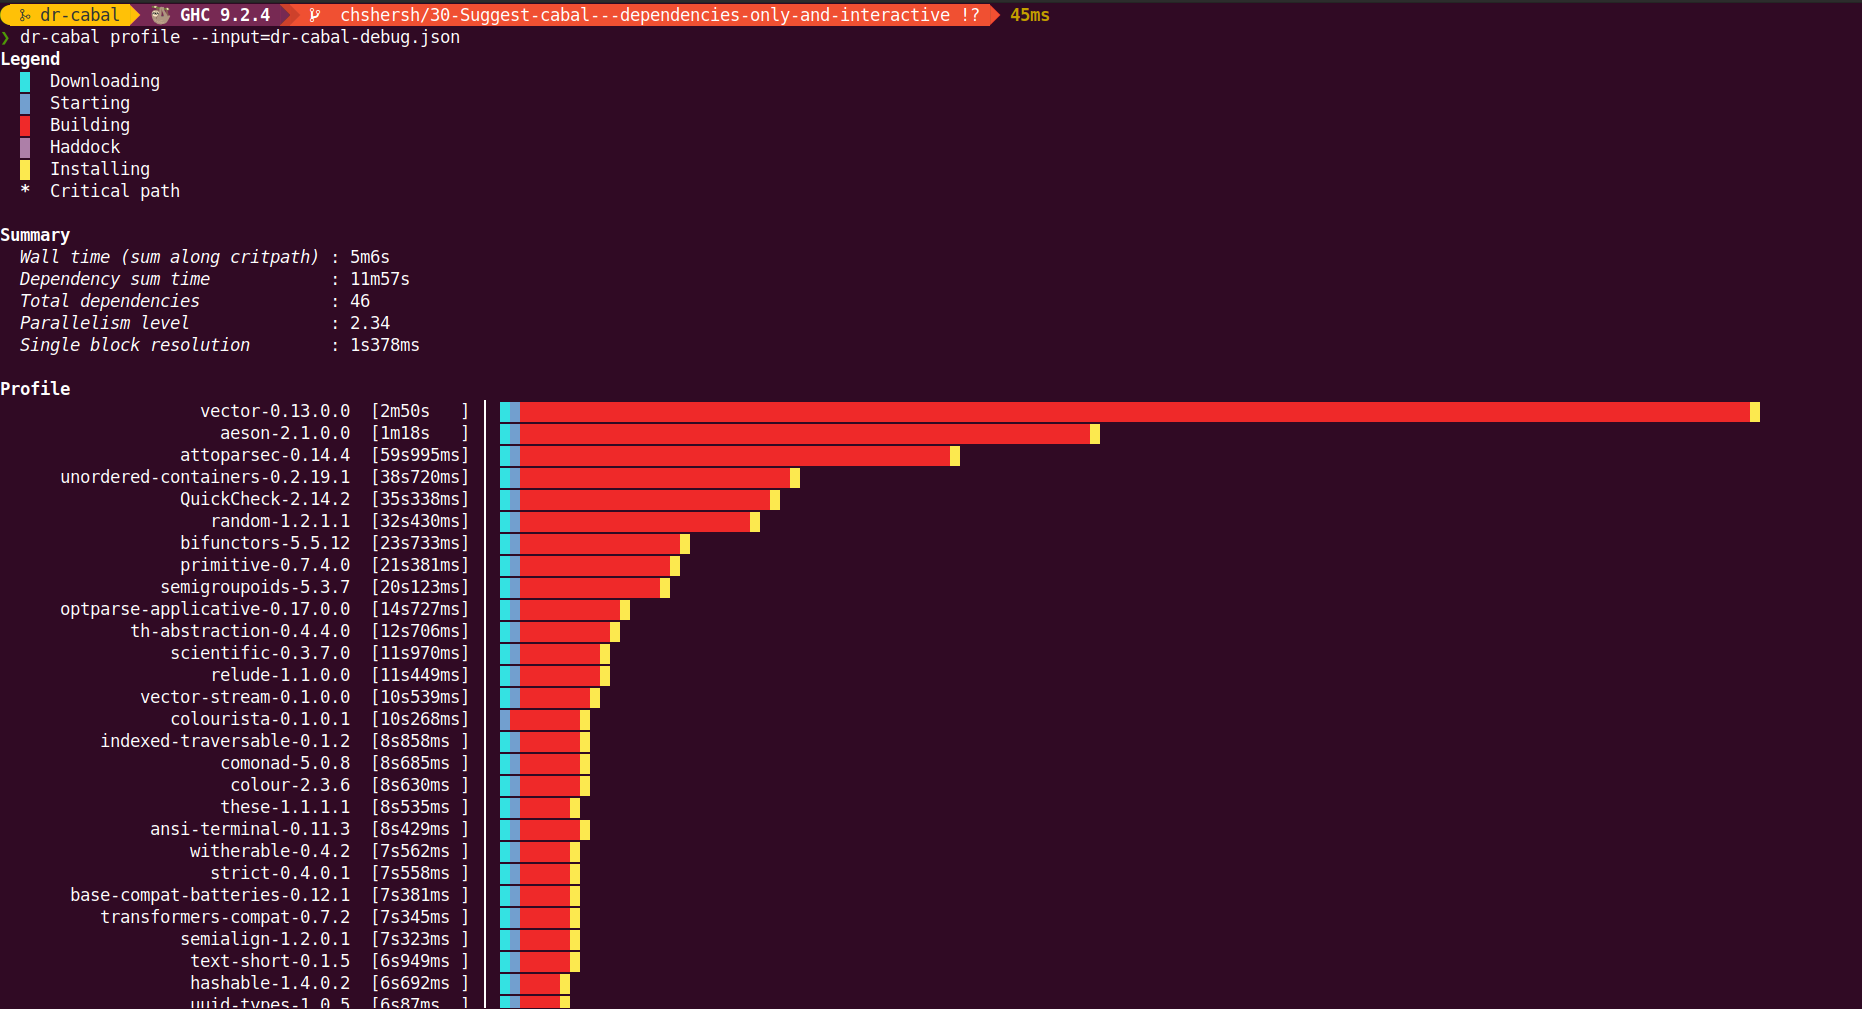
You'll see the output like on the image below: