R-pandoc-0.2.2: README.md
[](https://travis-ci.org/cdupont/R-pandoc)
A [pandoc](http://johnmacfarlane.net/pandoc/) filter to embbed R plots inside markdown documents.
See the [Blog post](http://www.corentindupont.info/blog/posts/Programming/2015-09-14-diagrams.html) for more details on usage.
## Usage
Install R:
sudo apt-get install r-base
Create a file called `demo.md` with the following text:
``` markdown
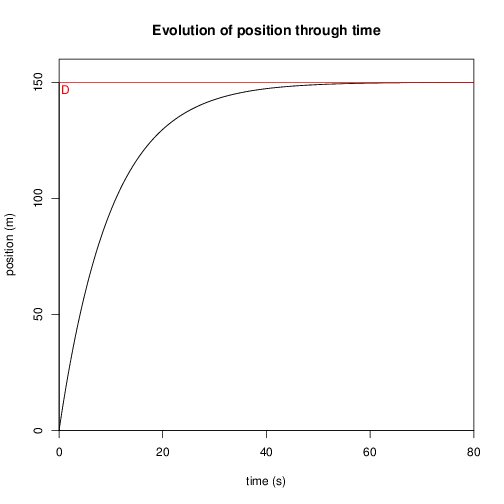
Here is a nice plot:
~~~ {.Rplot}
require(stats)
D = 150
T = 10
t = seq(0, 80, 0.01)
x = -D*exp(-(t/T))+D
v = (D/T)*exp(-(t/T))
plot(t, x, type="l", main="position through time", xlab="time (s)", ylab="position (m)", xlim=c(0,80), ylim=c(0, D+10), xaxs = "i", yaxs = "i")
~~~
```
Now run:
``` shell
pandoc -t html demo.md --filter R-pandoc -o demo.html -s
```
The file demo.html should now have a nice plot included:
## Details
`R-pandoc` compiles code blocks containing R plots
and includes the resulting images in the pandoc markup. It is meant
to be run as a
[pandoc filter](http://johnmacfarlane.net/pandoc/scripting.html) as
shown above.
## Installing
``` shell
git clone https://github.com/cdupont/R-pandoc.git
cd R-pandoc
cabal install
```